Distribution Dashboard
The distribution dashboard show the demographical information on your employees being tracked on the Conveya platform. This article goes through a breakdown of the charts that may be on your distribution dashboard.
ℹ️ Your distribution dashboard will only be populated by charts that your organisation sets. Therefore charts on this article may not fully reflect what you will see on your distribution dashboard.
Charts
Overall employee count on the Conveya platform
At the top of the distribution dashboard, you'll see the total amount of employees within your organisation.

Employees across the business
These charts show where employees are placed throughout the business, for example, within:
- Business Units
- Streams
- Sites
- Departments
- Divisions
- Branches

Employee types within the business
There are charts within the distribution dashboard that detail the types of profile on the Conveya platform. For example these can be:
- Programme types
- Course Levels
- Contract type
- Job titles

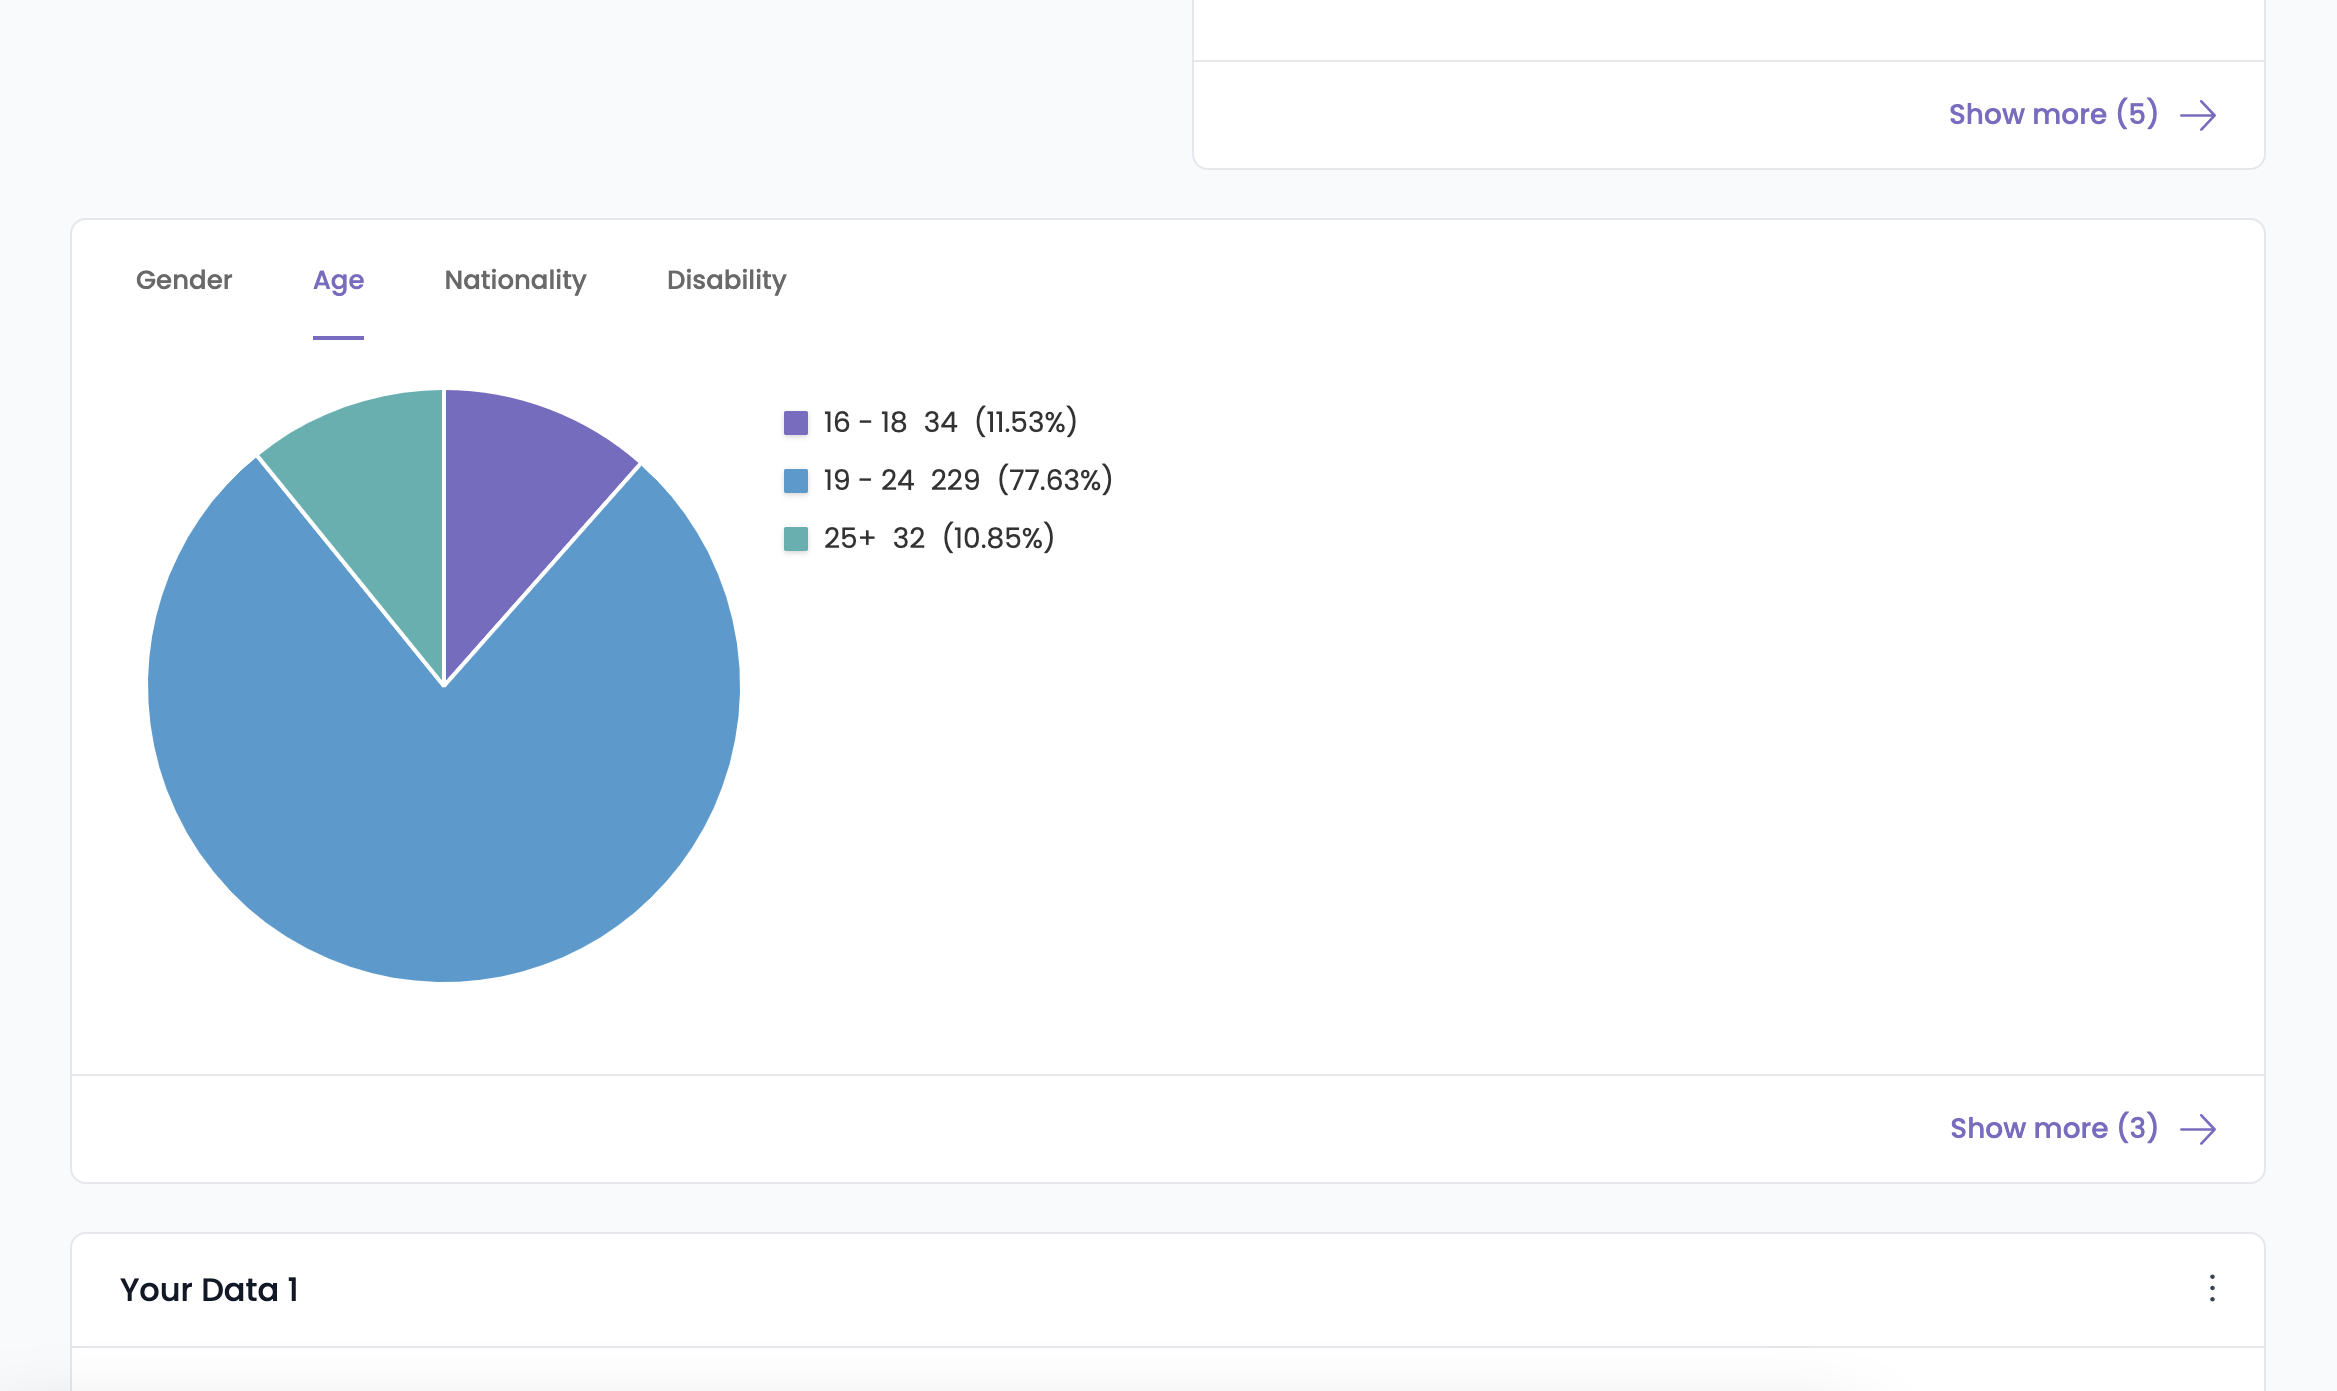
Demographic information across programmes
The distribution dashboard can display the demographic information across your programmes, such as:
- Age
- Gender
- Ethnicity
- Disability
- Nationality
Custom data
Every organisation is unique, there may be some specific metrics you'd like to track that are unique to your organisation. Conveya can track up to 10 custom fields of information, read our article on available fields when adding people via filedrop to learn more about using these custom fields.

